The two sides of the Power Law
When Peter Thiel became the first outside investor in Facebook, his initial $500,000 produced a return of over $1.1 billion and instantly became the stuff of legend. The experience led Thiel to become a fervent advocate of the Power Law – the concept that just a small number of investments are responsible for the largest share of returns – and its role in explaining how venture capital returns are distributed.
In the ensuing years, the Power Law has spurred heated discussions among the world's top VC firms. While few disagree on the basic principle that a portfolio's returns are determined by only a small fraction of its companies, opinions vastly differ regarding the lessons to take from the Power Law and its implications on portfolio construction. Is it better to index venture as broadly as possible in the hopes of unearthing those winning outliers? Or to concentrate resources on a smaller number of investments, so as to maximize returns on the winners?
In this article, I'll take an in-depth look at both strategies, debunk some common assumptions and map fund managers' thoughts on the subject, with the goal of sharing best practices across the early-stage venture capital industry and providing fund managers with a tool to enrich their understanding of this widely discussed topic. For this, I will be relying on data collected by Blue Future Partners through a survey of over 60 fund managers across the globe, as well as BFP's own proprietary dataset.
The limits to “spray and pray”
Venture capital is an extreme outlier business where a small number of investments drive most of the industry profits. Cambridge Associates data shows that out of more than 4,000 yearly investment rounds across over a decade, the top 100 have generated well over 70 percent of all returns. Similarly, looking at Blue Future Partners’ own fund portfolio, it is observable that even among the very top-performing VCs, some 10% of invested capital generates around 65% of returns.
In short, it takes a top-quartile VC fund to outperform the early-stage venture market. AngelList is a strong advocate for indexing the venture market, having conducted years of extensive research based on its own dataset of over 3,000 investments into startups. Its premise is that the opportunity cost of missing out on a winning investment at the earliest stages is theoretically infinite. Therefore, investors can increase their expected return by following a “spray and pray” model, broadly indexing into every credible deal – a strategy that, according to AngelList, will outperform roughly three-quarters of early-stage venture capital funds.
AngelList argues that you need to invest in a large portfolio of companies because no single investment is likely to produce significant returns, and only by widening your scope can you be certain to capture outliers. This statement has some truth to it in the sense that startup returns tend to be “almost” binary. In the graph below, we can clearly see the striking difference between a single startup investment and a normal VC portfolio (the light grey and dark grey lines, respectively).
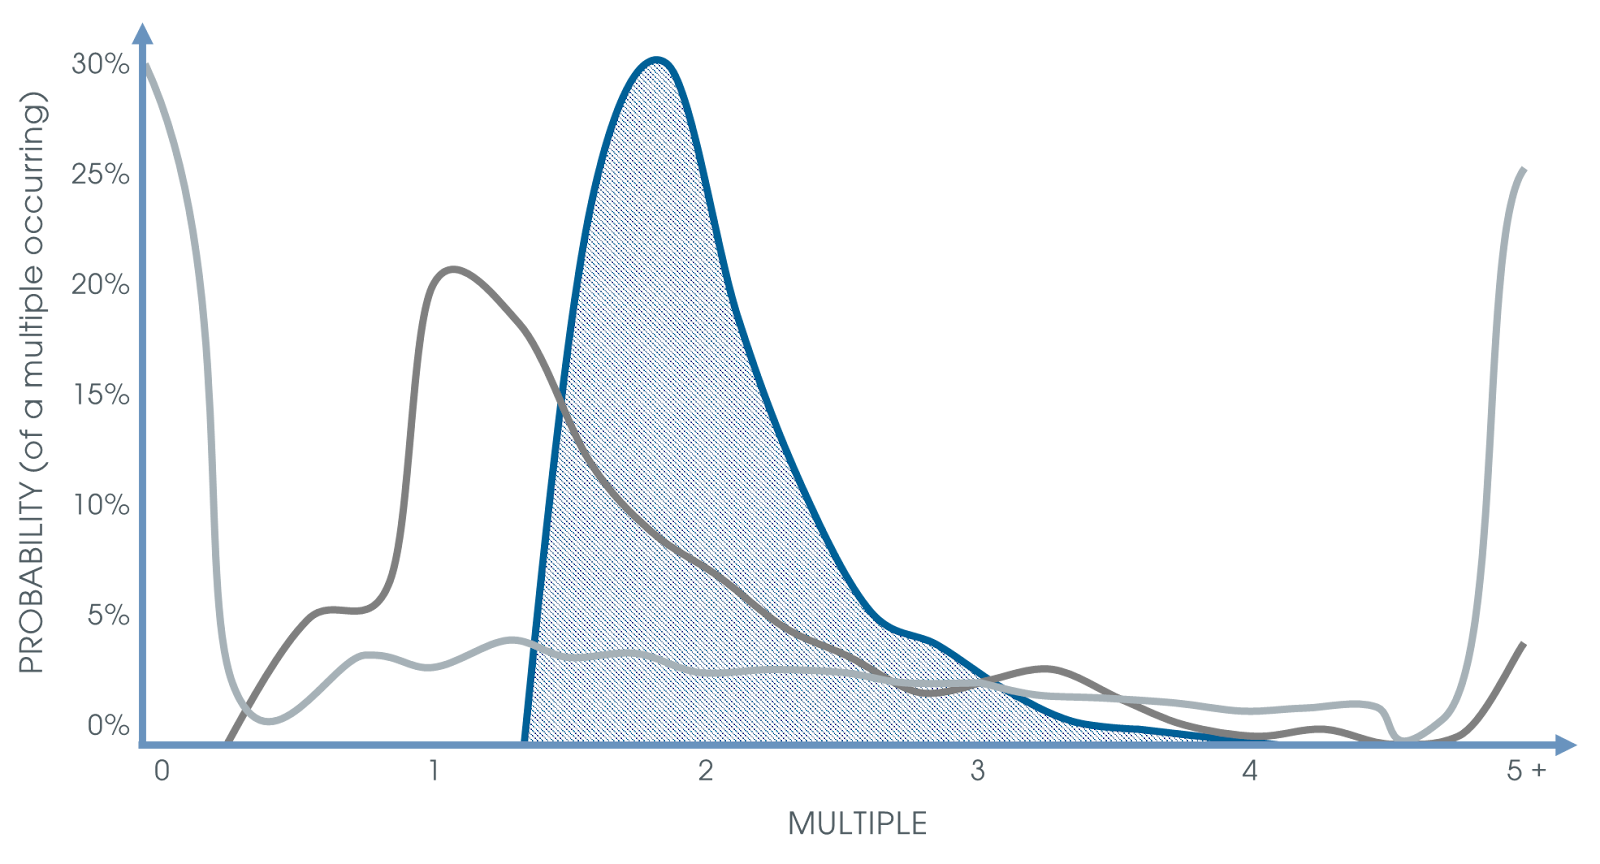
(If you’re curious about the shaded blue area, that would be the risk-return profile of a Fund of Funds! Feel free to reach out if you’re interested about learning more about it and that magical point where the three lines intersect 😉.)
AngelList, like many others, relies on a mechanical application of an even-outcome Monte Carlo simulation for its analysis. While the statements about diversification and capturing outliers are not necessarily wrong, the same cannot be said about the methodology used. Simply put, it doesn't reflect how the real-world works, especially outside of Silicon Valley.
The hardest part of setting up a Monte Carlo simulation is making a good set of assumptions, as these pre-determine the outcomes. The rule of thumb that guides VC returns was popularized in Fred Wilson’s 2012 blog post “The Power of Diversification”, which assumes that “the average startup has a 33% chance of making money for the investors, a 33% chance of returning capital, and a 33% chance of losing everything” and that “only 10% will make a big return”.
The crucial problem with these even-outcome Monte Carlo simulations lies in the fact that the real range of possible outcomes is much, much larger than any of the samples the simulation draws from. This is most obvious in Fred Wilson’s model, where there are only four possible outcomes (P X=0 = 40%; P X=1 = 30%; P X=3 = 20%; P X=10 = 10%), but the problem subsists with larger sets of possible outcomes as well. Even looking at AngelList’s dataset of actual outcomes, the simulation is still flawed as it implies that due to the large size of the sample, any real outliers are so unlikely that their expected value would not influence the average outcome in a significant way.
Take AngelList’s average outcome of 2.7x. If we were to add just a few outcomes that were not part of the set – e.g., a 2,200x, a 5,000x, and a 10,000x (Facebook, Uber, and Google’s seed multiples, respectively) – the average of the distribution increases to over 27.7x. Even if we only added Thiel’s famed Facebook investment, the average outcome would more than double to 5.9x. This shows just how significant an effect the extremely unlikely tail of the venture capital Power Law distribution can have on its mean.
The above example enables us to draw the following conclusion. In venture capital, for any given set of actual or simulated outcomes, the mean of the sample does not represent the average of the total Power Law distribution, as the contribution of the tail of the distribution – unlikely though it may be – is theoretically infinite. Even if all venture investments in history were to be considered as a sample, the resulting Monte Carlo simulation would still be flawed.
Thus, the Monte Carlo simulation should not derive from a sample dataset, but rather from the underlying distribution the data is assumed to be drawn from. Using the rule of thumb as a baseline – i.e., assuming 1/3 of startups fail, 1/3 of startups collectively return capital and 1/3 return more than 1x – we can compute a Monte Carlo simulation to model the probability of a portfolio of a given size exceeding a certain benchmark return; e.g., 1x, 2x, 3x, and so on.
The simulation (source) yields the following:
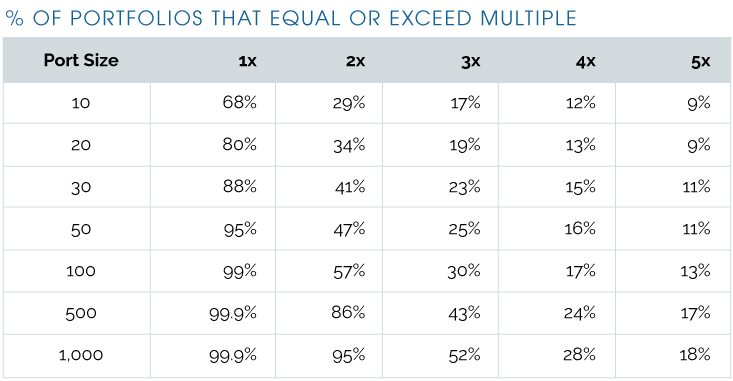
The model shows that investing in 100+ companies at the earliest stages does, in fact, reduce the risk of losing investors’ money and may very well lead to investing in an outlier. A portfolio comprising 100 companies has a theoretical 99% change of returning the capital, and a 57% chance of achieving a 2x return – nearly twice the likelihood of a portfolio of only 10 startups. This phenomenon raises the question: which level of diversification is necessary to achieve risk reduction while protecting the possibility of significant outperformance?
Let's take a 5x return as the benchmark to beat – as the table shows, this is an unlikely outcome and a clear top-decile fund in any given vintage year. A portfolio of 20 companies has a 9% chance of surpassing the benchmark; to double that probability, you would have to invest in well over 1,000 companies. The key takeaway from this analysis is that the chance of outperforming any given benchmark increases with portfolio size, but only marginally. In other words, as one of Blue Future Partners' own portfolio managers puts it, “the benefits of diversification tail off pretty hard”.
This model tries its best to be a good proxy for how the real-world works. As such, it presumably includes various types of signaling that go on between entrepreneurs and investors and among investors themselves, and even the impact the help and mentoring from an investor can have on a company’s chances of success, especially in its early stages. The secret lies in the balance between the decreasing rate of growth in probability of beating a certain benchmark and the number of companies a GP can actually help at any given point in time.
How Emerging VCs Think About Portfolio Construction
Not long ago, Blue Future Partners conducted a global survey on portfolio construction best practices amongst emerging fund managers in an attempt to map the early-stage venture capital landscape.
The data shows a clear pattern in the profiles of the fund managers surveyed, with a median fund size of $56 million and a clear concentration of investments in early-stage companies, i.e., between Pre-Seed and Series A (85% of the sample), deploying a median ticket size for initial investments of approximately $850,000, and reserving 55% of committed capital for follow-on opportunities.
However, this pattern does not extend to some of the key aspects of portfolio construction, like portfolio size, ownership, or even exit expectations.
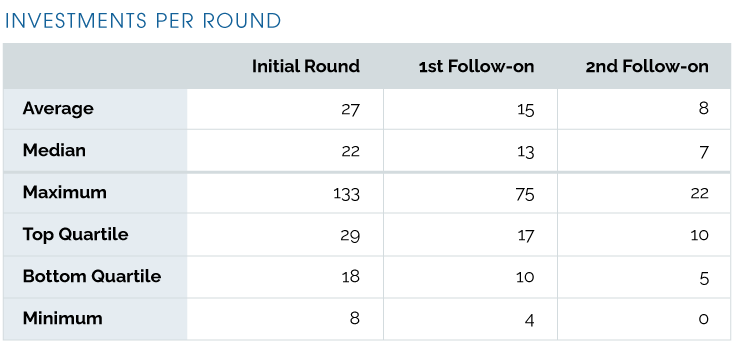
The table above shows just how much investment strategy and overall portfolio construction can differ between fund managers, with some investing in over 100 companies and others in under 10. Also, the data shows that most fund managers – the first three quartiles – invest in fewer than 30 companies. This can be seen as a signal that most fund managers perceive 30 as the number of investments above which it becomes increasingly difficult to properly assess and select deals and/or effectively support the portfolio companies.
Furthermore, we can observe that the number of investments in follow-on rounds decreases approximately by half with each round, meaning that fund managers will seek to invest in the subsequent rounds of only the most promising companies in their portfolio. Both median and mean present the same pattern throughout the investment cycle, differing substantially only in the initial round due to some outliers that follow a “spray and pray” strategy – investing heavily in the initial round and limiting their follow-ons to a very small fraction of the portfolio. This inadvertently leads to higher levels of dilution in the stakes as fund managers choose not to make full use, if any, of pro-rata rights to defend their position. Nonetheless, across the sample, ticket sizes in follow-on rounds increase by a median of 78%, illustrating how most fund managers tend to increase the ticket size throughout the life cycle of an investment in an attempt to concentrate capital on their potential outliers.
Unicorn or Dragon?
Another very important aspect of portfolio construction relates to fund managers' ownership stakes in each portfolio company, as this will ultimately be key to the impact each outlier will have on the fund’s returns.
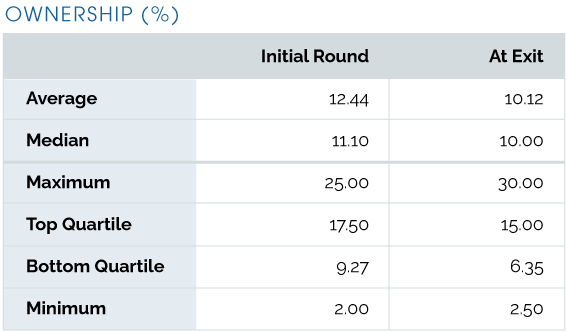
The table above shows us that average ownership expectations consist of a double-digit number in the low teens, both at entry and at exit. This is consistent with the fund managers' preferences when it comes to portfolio size, as a more concentrated portfolio fund allows managers to concentrate and optimize ownership from the first investment into a company.
Furthermore, it is observable that there is no significant difference between entry and exit ownership stakes, with fund managers assuming an average 18.5% dilution across the entire life cycle of the investment. This dilution assumption is of the utmost importance. Historical data has proven that stakes in a company can be severely impacted by dilution, regardless of fund managers defending their position with capital reserves kept for follow-on rounds. The assumption that fund managers are able to keep ownership virtually unchanged over time is not realistic. However, let me remind you that the table above is derived not from historical data, but from the expectations of the fund managers surveyed.
What this shows is that, on average, fund managers tend to be overly optimistic when it comes to estimating their stakes at exit, something that both these managers and their limited partners should keep in mind when building portfolios or assessing investment opportunities.
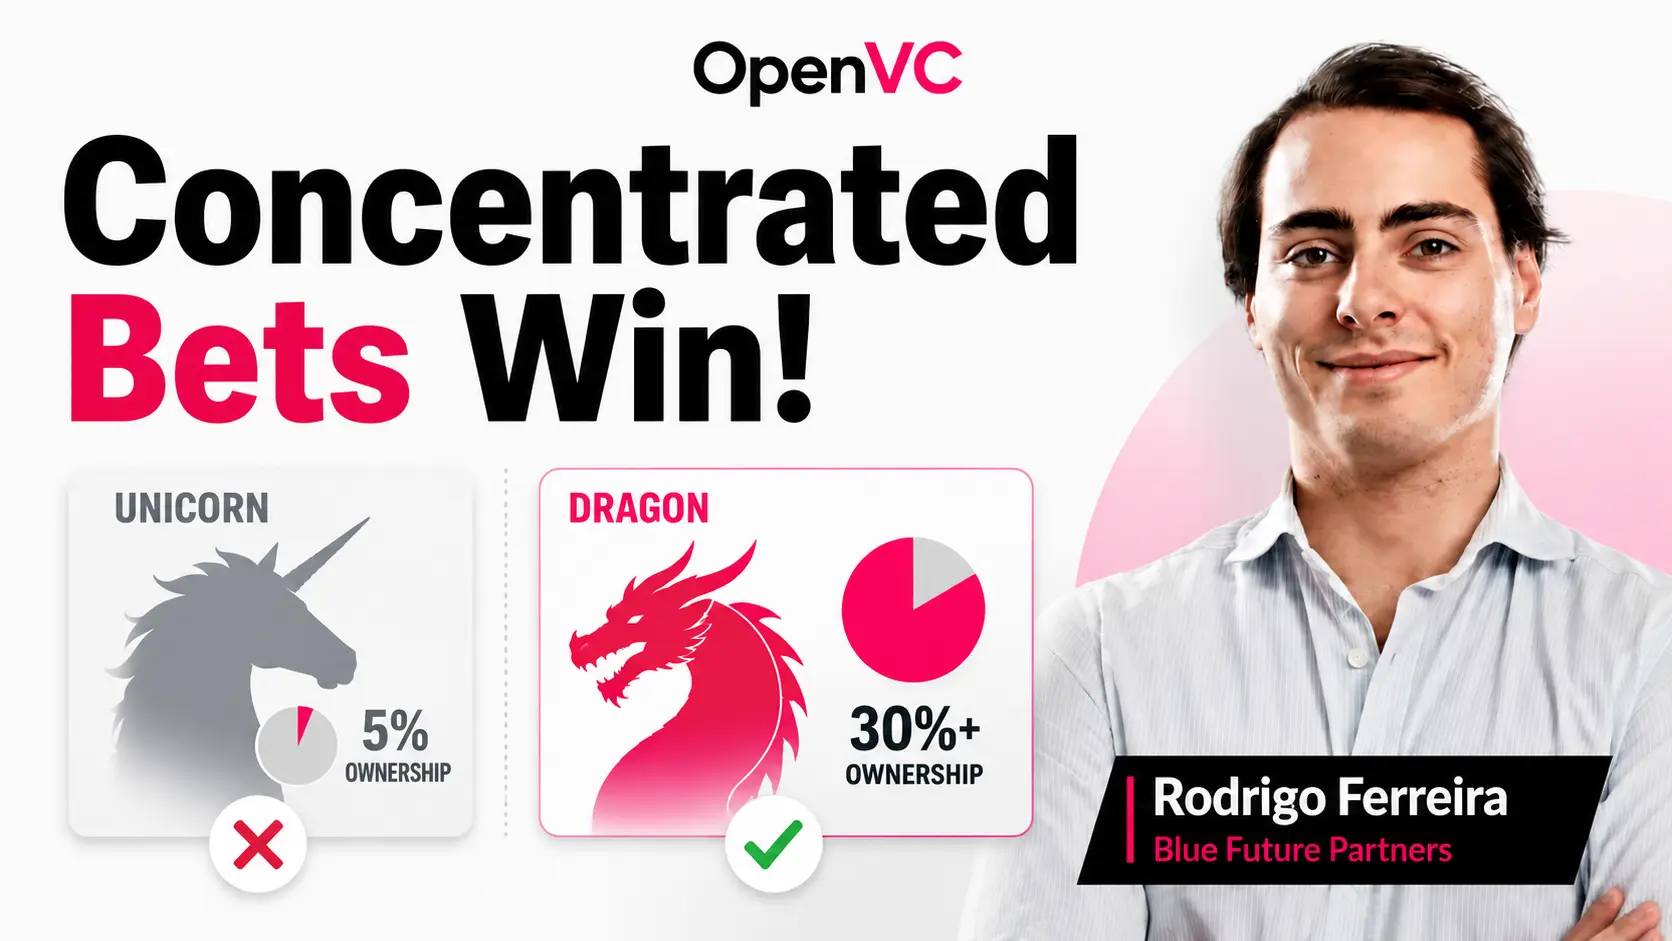
The reason why ownership, especially at exit, is so important for portfolio construction has to do with the impact the exit value of a portfolio company has on the overall fund’s returns. Fund managers are often blinded by the idea of investing in Unicorns (companies with a valuation in excess of $1B). However, the true secret to outsized fund returns lies in the pursuit of Dragons.
A Dragon is a portfolio company that, upon its exit, returns the entire fund at least 1x, regardless of the return multiple on the individual investment. A company does not need to be a Unicorn to be a Dragon. The fund manager needs only to own a meaningful stake in the company – to “have enough skin in the game”, if you will. Ownership will ultimately determine which exit will be more impactful for returns.
Take for example two distinct fund managers, both with $50M funds investing in seed stage companies (resulting in $40M of investable capital, assuming no recycling and a standard 2% management fee). One of the fund managers follows a “spray and pray” approach, while the other believes in having a high-conviction, high-concentration portfolio. The first fund manager, assuming a 100-company portfolio, deploys an average ticket size of $400,000, which at a $12M seed valuation will acquire around 3% of a company. Assuming a 18% dilution (following fund managers' expectations) and an exit at $1B valuation, this would generate ~$27M in proceeds, representing a 67.5x multiple on capital invested and returning 0.54x the entire fund – a great deal, to say the least. Now let’s look at the second fund manager. Assuming a 20-company portfolio and the average 12% ownership expectation from our sample – resulting in ~10% ownership at exit – they would only need a $250M exit to achieve the same 0.54x return. To have a Dragon, the second fund manager would need only a $500M exit, while the first fund manager would require a nearly $2B exit. This is assuming the same dilution for both managers – which would in fact not be the case, as the first fund manager would have been through more up-rounds and thus more dilution.
Exit and Return Expectations
As the above example shows, fund managers do not necessarily rely on multi-billion-dollar outcomes to achieve outsized returns, and one's portfolio strategy should not be driven solely by those potential outcomes. Instead, it's important to focus on how much an investment can return to the fund, relying more on ownership than valuation. On multiple occasions, we at Blue Future Partners have seen companies with “modest” valuations, i.e., sub-$500M, return an entire fund, with several of our portfolio managers following the pursuit of Dragons rather than Unicorns.
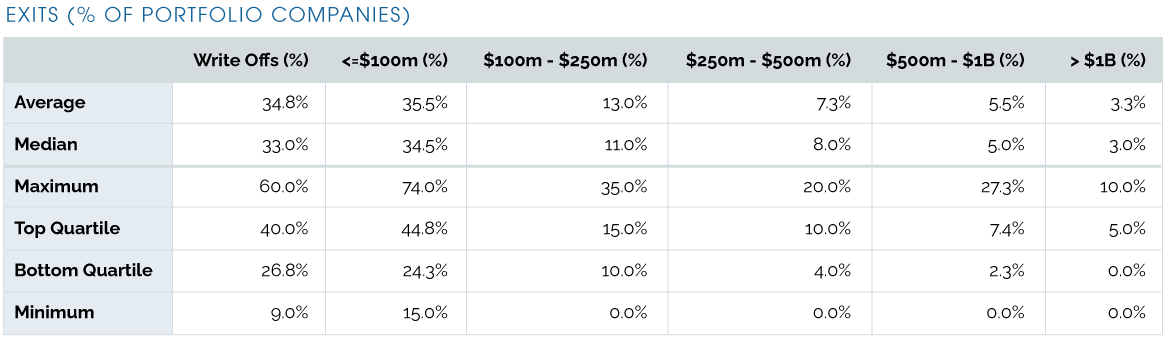
The above table shows that, overall, fund managers' expectations are in line with the traditional rule of thumb, confirming managers' beliefs that around 1/3 of the portfolio will return less than 1x the investment, 1/3 will return the full capital or a non-significant multiple, and 1/3 will have outstanding returns.
Fund managers expect just over 3% of the companies in their portfolios to surpass the $1B threshold. For a portfolio comprising 20 to 30 companies, this translates into a number lower than 1. This shows that fund managers generally do not expect to have Unicorns in their portfolio, and in fact companies that do surpass the $1B threshold are extremely rare – even in the current market environment.
From the expectations above, we can compute a mockup portfolio model to better understand the contribution of each valuation range to a fund’s returns.
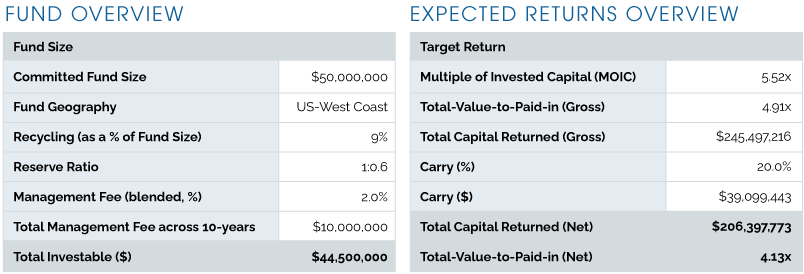
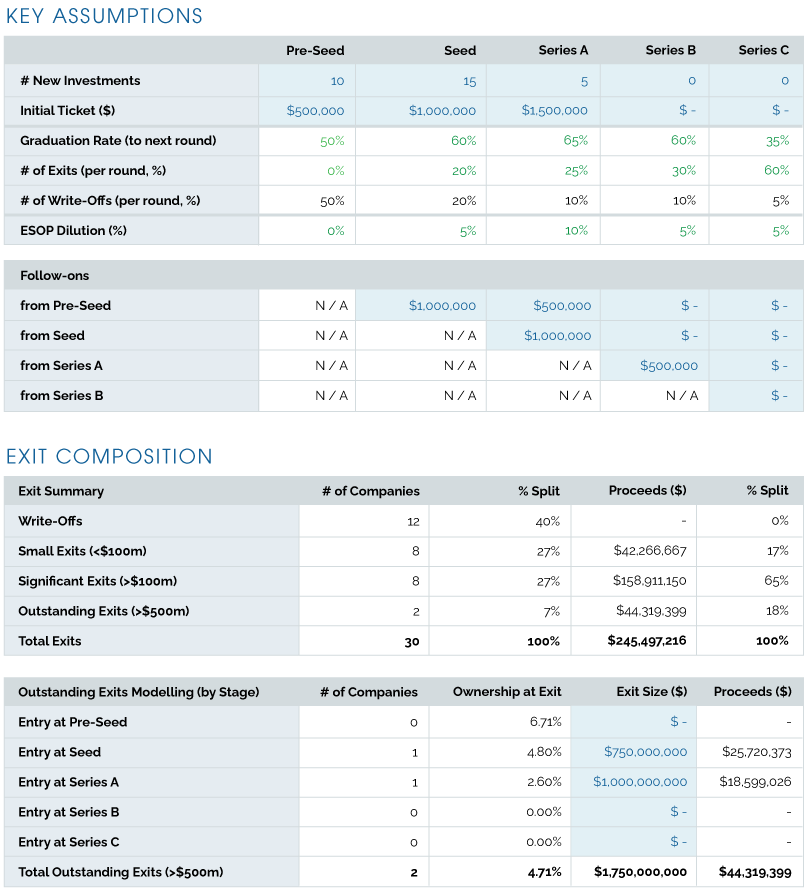
The model above shows that a $50M fund could potentially generate gross returns of $245M or 4.91x and net (of carry) returns of $206M or 4.13x, a clear top-quartile performer.
If we deconstruct the different exits and their respective contribution to the overall return, we can observe that returns are not fully reliant on single companies. Despite the top two companies contributing 18.1% of the overall returns and returning 1x the invested capital, companies exited in the $100M to $500M range account for the bulk of returns, i.e., 64.7%. The model does not, however, account for each fund manager’s unique ability to add value to the portfolio companies – nor the ability to concentrate reserves around the outlier companies, thus leading to the presence of Dragons in the portfolio. Instead, it takes a more standardized approach to entry valuations (Pitchbook) and use of reserves, resulting in fairly low ownership stakes at exit. Using actual data from the Blue Future Partners portfolio, it is not uncommon to see emerging fund managers maintain high ownership stakes (e.g., 7-10%) even at multi-billion-dollar valuations, resulting in the top companies representing a much larger portion of fund returns.
My Two Cents
When setting out to write this article, I wanted to show both sides of the Power Law – in other words, the two possible interpretations that derive from the assumption that venture returns follow a Power Law distribution.
From the somewhat tough-to-chew section on portfolio construction math (apologies for that...), I hope it became clear why the methodology used by the majority of people writing on the subject is flawed. To recap, assuming venture returns follow a Power Law, we cannot use a fixed set of outcomes as the basis for simulating venture portfolios, even if we are running Monte Carlo simulations with 10,000 iterations. We must first use that set of outcomes – preferably actual historical ones, such as the AngelList dataset – to derive the underlying profitability distribution that led to those outcomes. Only then will we, by means of that distribution, be in a position to simulate the corresponding portfolios.
With regards to the optimal size of an early-stage portfolio, the data collected shows a plurality of strategies and approaches to portfolio construction, with fund managers presenting strong, compelling arguments in favor of each. Nevertheless, a strong preference for more concentrated portfolios may be seen among emerging fund managers, further contributing to the widely held belief that VCs can “pick winners”.
Likewise, when it comes to the importance fund managers attribute to ownership, most believe in maintaining a significant stake at exit, using follow-on investments to limit and control dilution. Only a select few embark on building highly diversified portfolios with aggressive upfront investments and no major reserves, purely “chasing Unicorns”.
In terms of returns and overall fund performance, Dragons are the “new Unicorns”. While fund managers do believe they can identify companies with outlier potential, returns will ultimately be driven by the significance of the fund’s investment. And while “picking winners” might be overly reliant on luck, having the right investor on the cap table can definitely skew the scale and play a significant role in “building a winner”.
For a more in-depth take on how important it is for founders to pick the right investors, have a look at one of my previous articles: “ Good entrepreneurs choose their VCs ”.
In our ever-changing global venture ecosystem, portfolio construction can be both contentious and confusing. Fund managers struggle to find the information and resources to design the right strategy and understand this key aspect of venture capital.
I encourage emerging fund managers, or the ones still in the early stages of breaking into venture, to use this article as a resource to draw their own conclusions, gain new insights, and learn about their peers' approach to portfolio construction. This article is but a small contribution towards increasing the availability of reliable industry-wide data.
Acknowledgement: I am far from being the first person to write about this topic, and as such I would like to show my deepest appreciation to those who came before me, without whom this article would not have been possible. I am but standing on the shoulders of giants.
About Rodrigo Ferreira
In Munich since 2019, Rodrigo focuses on sourcing and leading new investments and follow-on opportunities for BFP investing in both emerging managers and early-growth startups across the world.
Rodrigo can be reached at [email protected]
About Blue Future Partners
Blue Future Partners is a Fund of Funds with decades worth of experience in investing in Venture Capital and specializing in backing Emerging Managers focused on early-stage technology investments.


![12 Best Startup Financial Model Templates [Free & Paid]](https://d1pnnwteuly8z3.cloudfront.net/images/177302d9-3657-45b7-ac9d-acf801d83a74/1b029edf-43cf-4bd9-9e37-203f66bf426f.png)