Table of Contents
What is a Financials Slide?
The financials slide gives investors a snapshot of your startup’s financial health, growth potential, and overall viability. It’s a deep dive into the engine room of your business, showcasing your revenue streams, expenses, and key financial projections for the next few years.
But here’s the truth: most investors know your financials won’t play out exactly as planned—no startup ever hits its projections perfectly. What matters is that your numbers are grounded in realistic assumptions and demonstrate your understanding of how your business makes money, spends money, and scales over time.
The key to a great Financials Slide isn’t overloading it with every data point or forecast—it’s telling a compelling, numbers-driven story about your business model. This includes things like revenue growth, burn rate, runway, profitability milestones, and cost structure. For Series A or later rounds, investors expect to see 3–5 years of projections. Early-stage founders can focus on major KPIs (e.g., CAC:LTV, gross margins) to build confidence.
If you’ve done the homework on your financial model, this slide can become a powerful tool to earn investor trust. Keep it focused, clear, and backed by data—let the numbers do the talking.
Pro Tip
If you’re an early-stage founder without revenue or detailed projections, focus on explaining your unit economics and financial KPIs like CAC, LTV, and burn rate. Use these to show you have a handle on your business model and scalability.
What Do Investors Look for on a Financials Slide?
- Evidence of scalable revenue streams and realistic projections.
- A clear breakdown of costs, including customer acquisition, operations, and cost of goods sold (COGS).
- Metrics like CAC, LTV, gross margin, burn rate, and runway are essential.
- Financial forecasts based on achievable growth rates and reasonable benchmarks.
- When your startup will reach profitability or key financial goals, such as breaking even.
🤔 What Questions Should a Financials Slide Answer?
- How much revenue will the business generate, and over what timeline?
- What are your largest expenses, and how do they impact profitability?
- When will your startup break even or become profitable?
- How much cash are you burning, and how long will your runway last?
- What assumptions underpin your projections, and are they realistic?
❌ Common Mistakes to Avoid
- Presenting overly optimistic projections without credible data or benchmarks to back them up.
- Leaving out critical expense details, such as customer acquisition costs (CAC) or cost of goods sold (COGS).
- Overcomplicating the slide with excessive data or visuals that are hard to interpret.
- Failing to include essential metrics like burn rate, runway, or profitability milestones.
- Making unrealistic claims about capturing significant market share too quickly.
How to Create a Financials Slide That Investors Will Love
✅ Financial Slide Best Practices
- Focus on Clarity: Use visual aids like bar graphs, pie charts, or simple tables to show data trends. Avoid cluttering the slide.
- Ground Projections in Reality: Show evidence to support your assumptions, whether it’s market research or historical data.
- Include Key Metrics: Highlight KPIs like CAC, LTV, gross margin, burn rate, and runway to show you understand your financial health.
- Prioritize What Matters: Focus on high-impact data points that reflect your startup’s growth potential and scalability.
- Align with Funding Needs: Ensure your financial story ties back to your funding request and how you’ll allocate the capital.
✍️ Financial Slide Content
- Headline: Summarize your financial story in one sentence (e.g., “Sustainable growth with a 60% gross margin and $1M ARR by Year 3”).
- Revenue and Growth Projections: Include a graph showing your revenue over the next 3–5 years.
- Expenses Breakdown: Use a pie chart or table to show key spending categories (e.g., product development, marketing, operations).
- Key Metrics: Display CAC, LTV ratios, gross margin, and burn rate prominently.
- Runway and Milestones: Highlight how long your runway lasts with current funding and when you’ll hit profitability or breakeven.
🎨 Financial Slide Design
- Simplified Financial Charts: Use bar graphs to show revenue growth, pie charts to break down expenses, and line charts to illustrate projections over time. Avoid overly detailed tables that are hard to digest.
- Key Metrics in Focus: Highlight crucial numbers like ARR, CAC, LTV, and burn rate with bold typography or callouts, making them easy to spot at a glance.
- Visual Consistency: Ensure that all charts and visuals are styled consistently with your pitch deck’s overall theme, using your brand colors and clean, professional fonts.
- Organized Layout: Arrange visuals in a logical flow—revenue on one side, expenses on the other, and key metrics prominently displayed in the center or at the top.
- Whitespace for Clarity: Leave enough spacing around each visual or section to prevent overcrowding and maintain a clean, professional appearance.
Financials Slide Examples
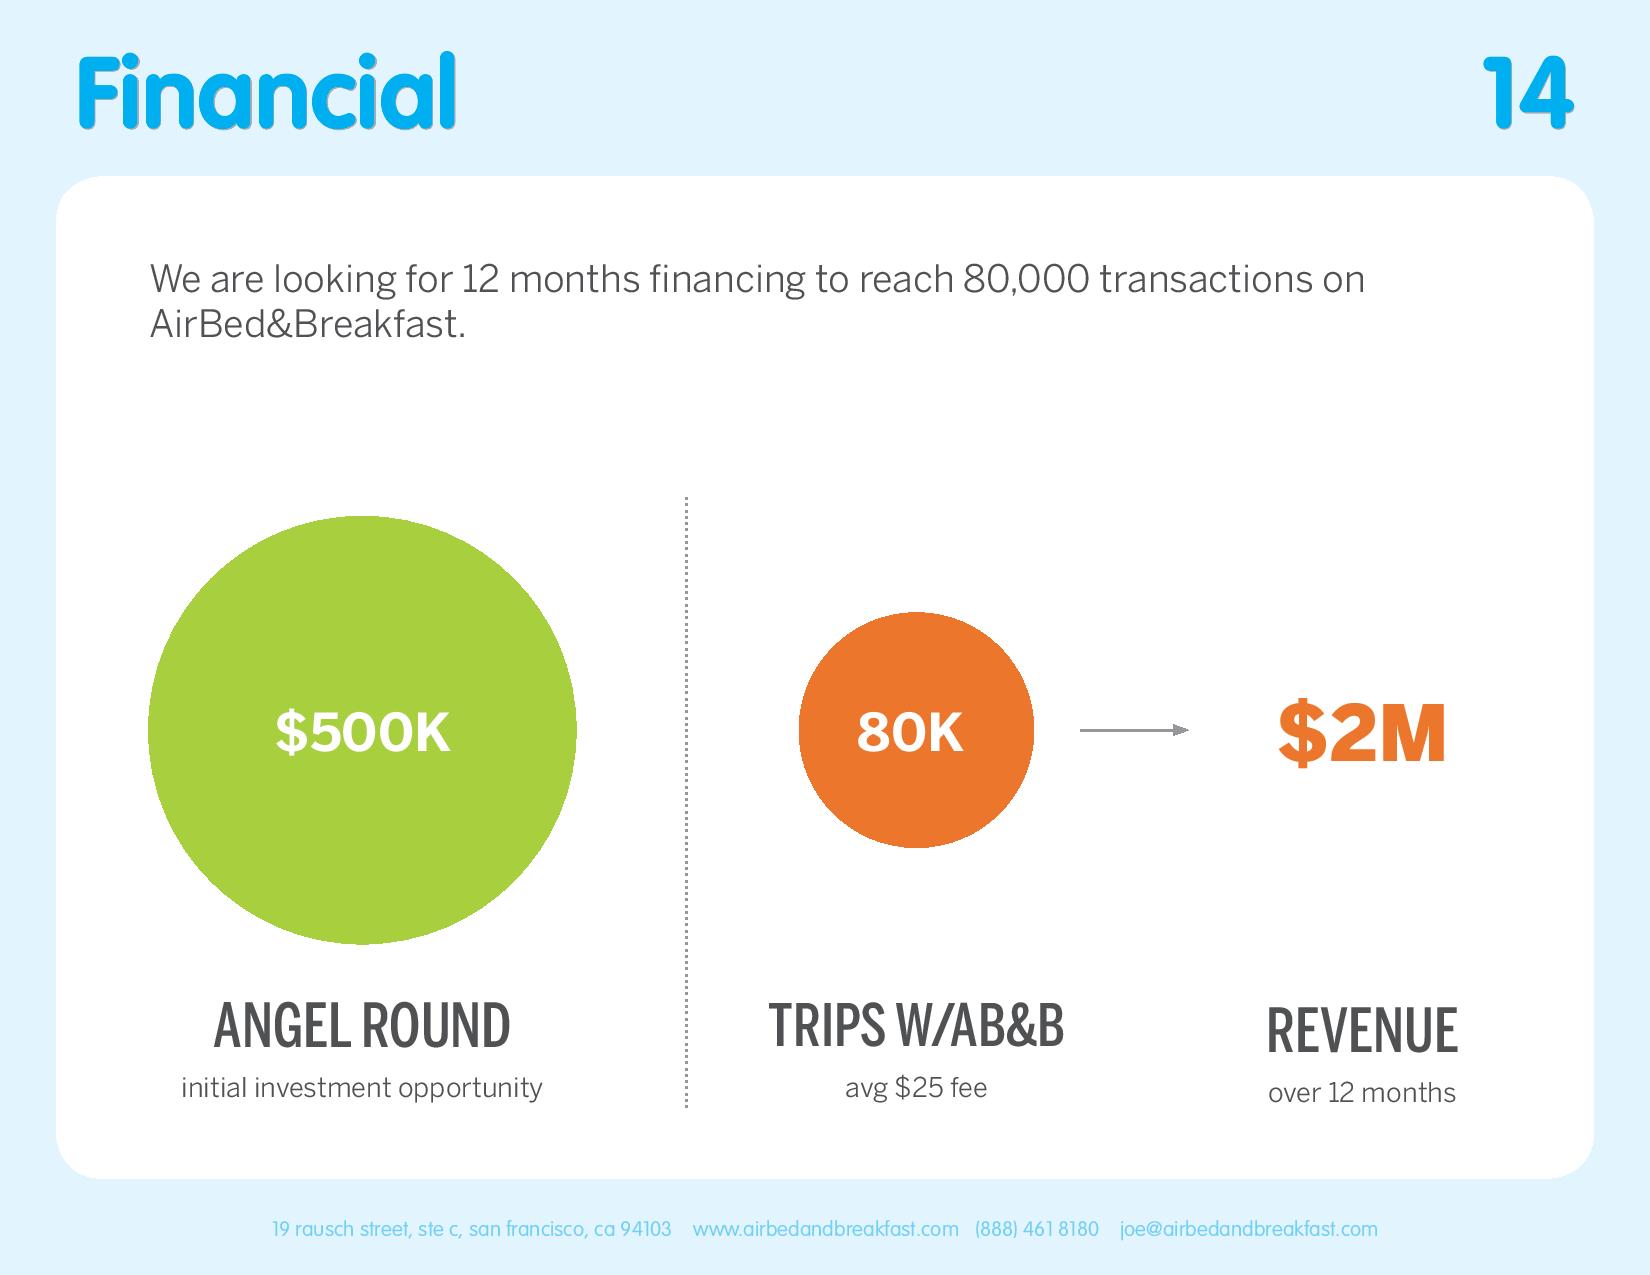
AirBnB
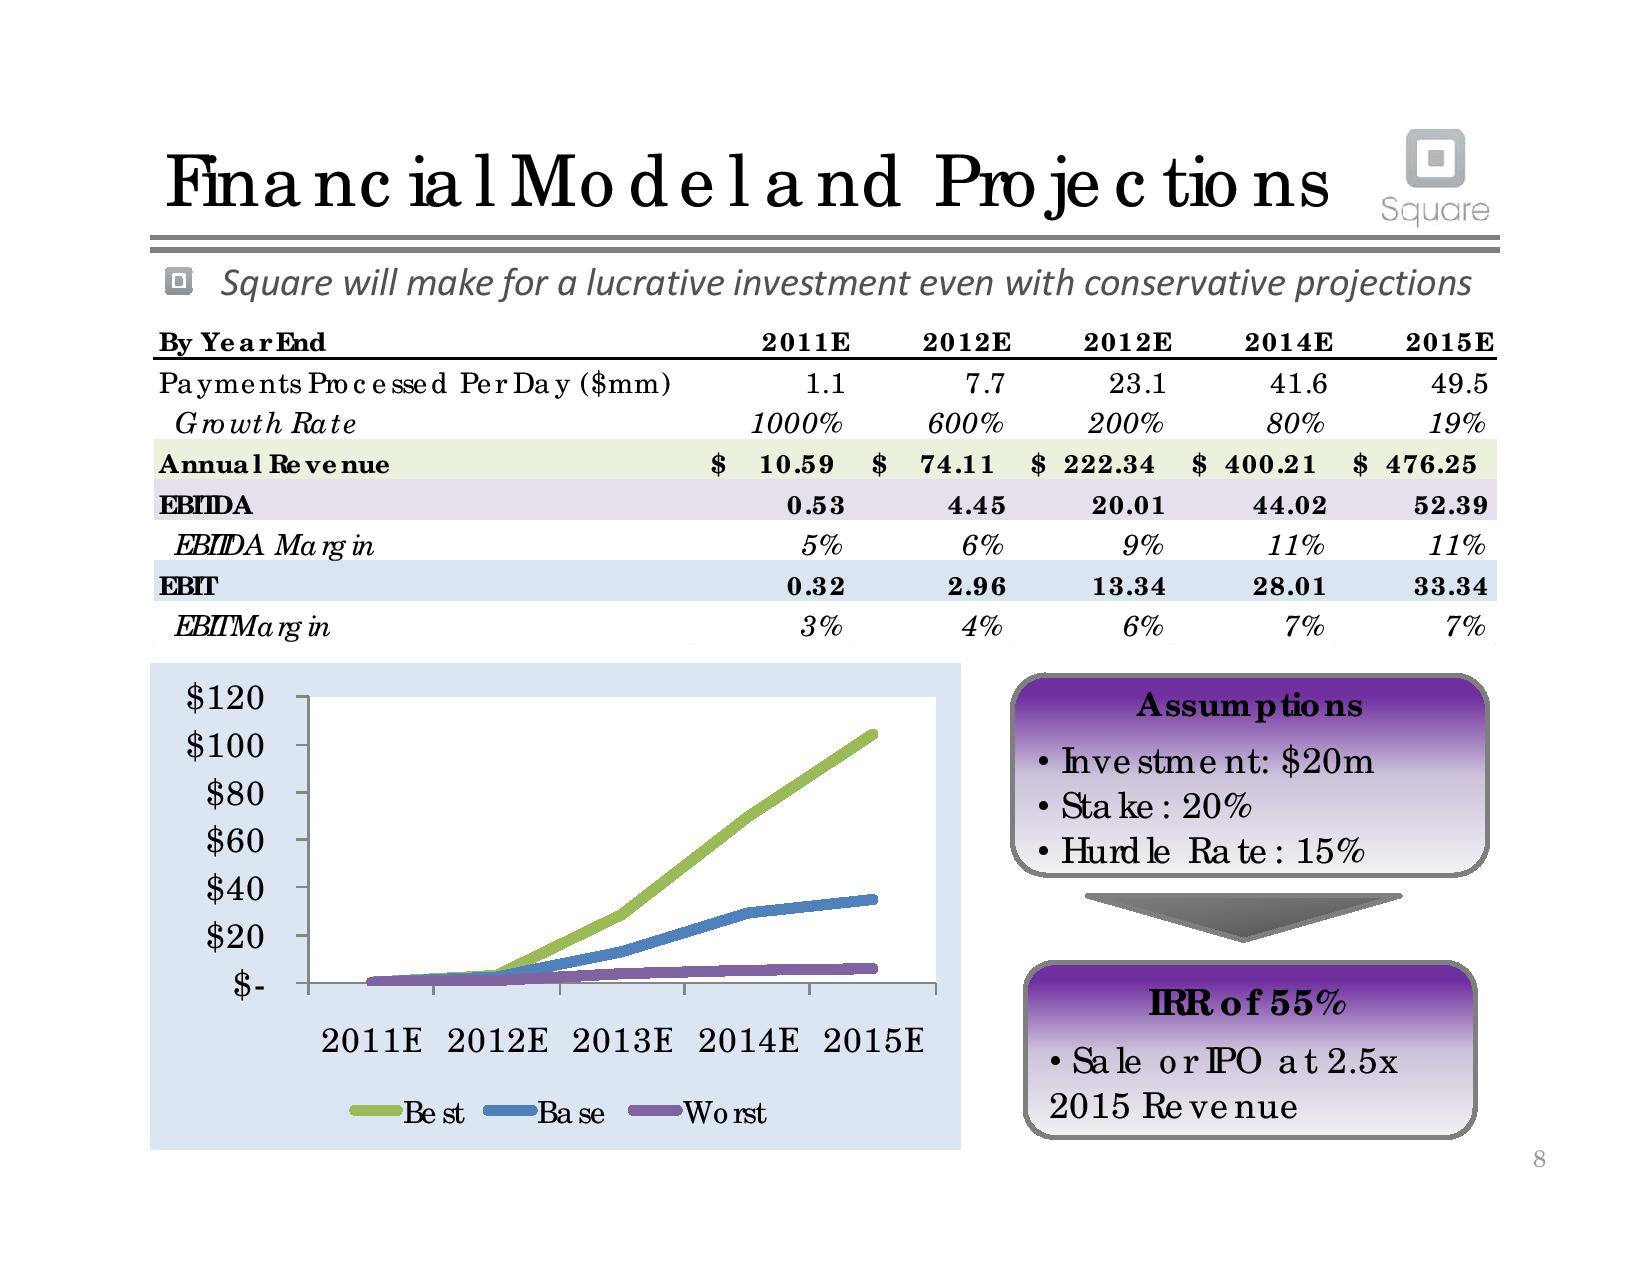
Square
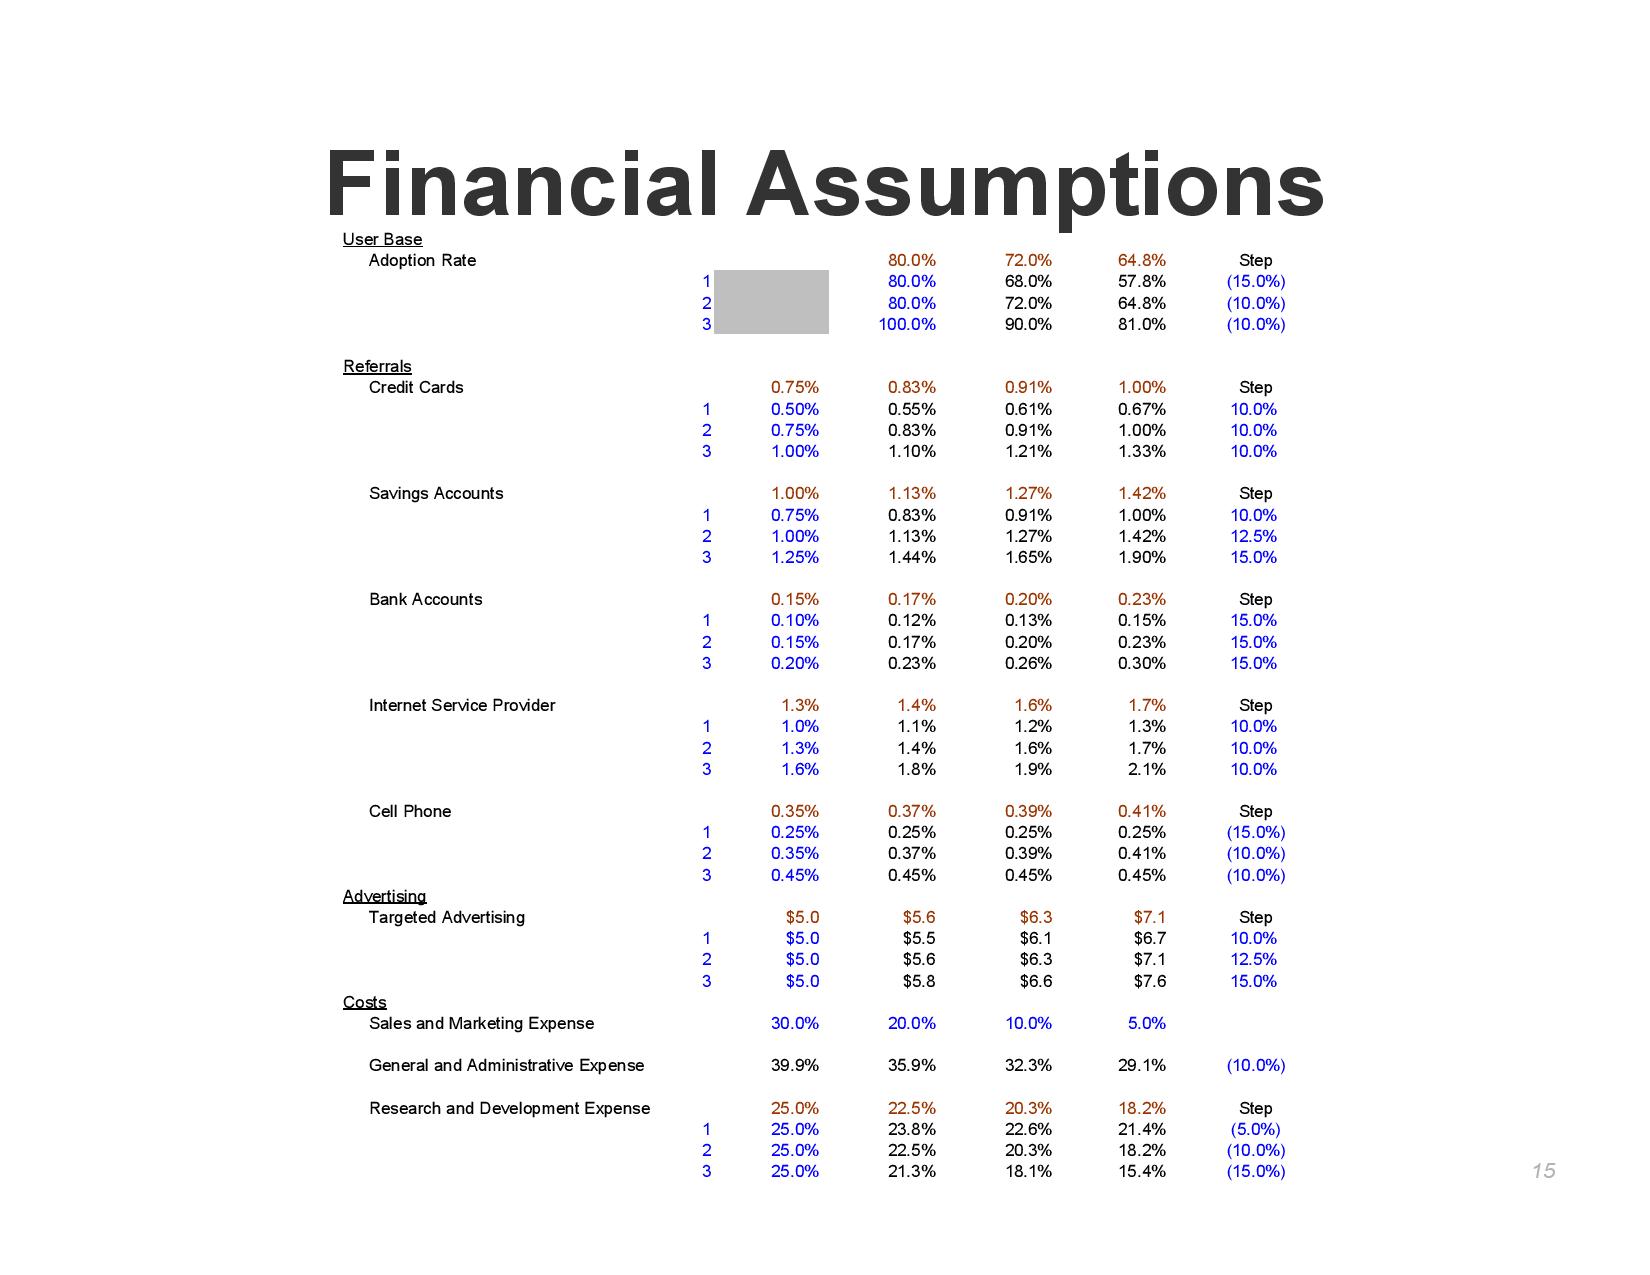
Mint
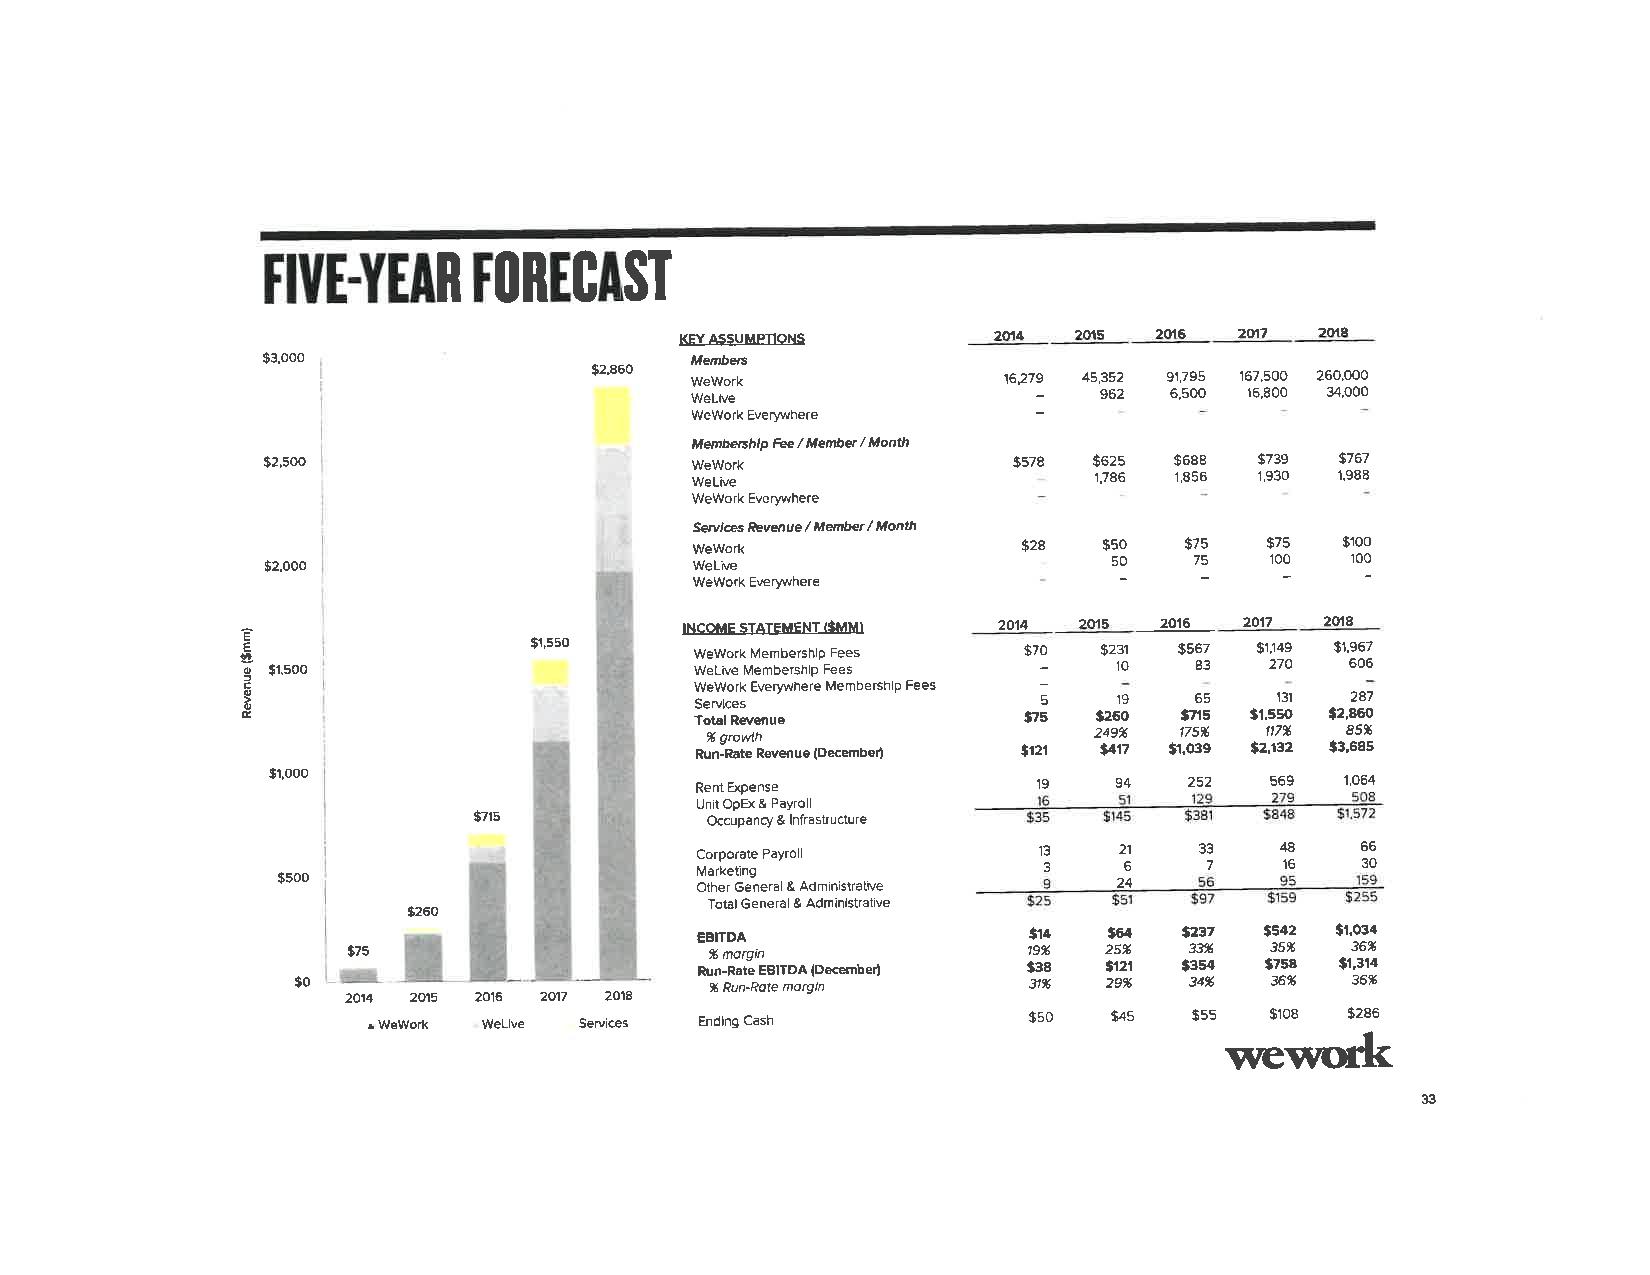
WeWork
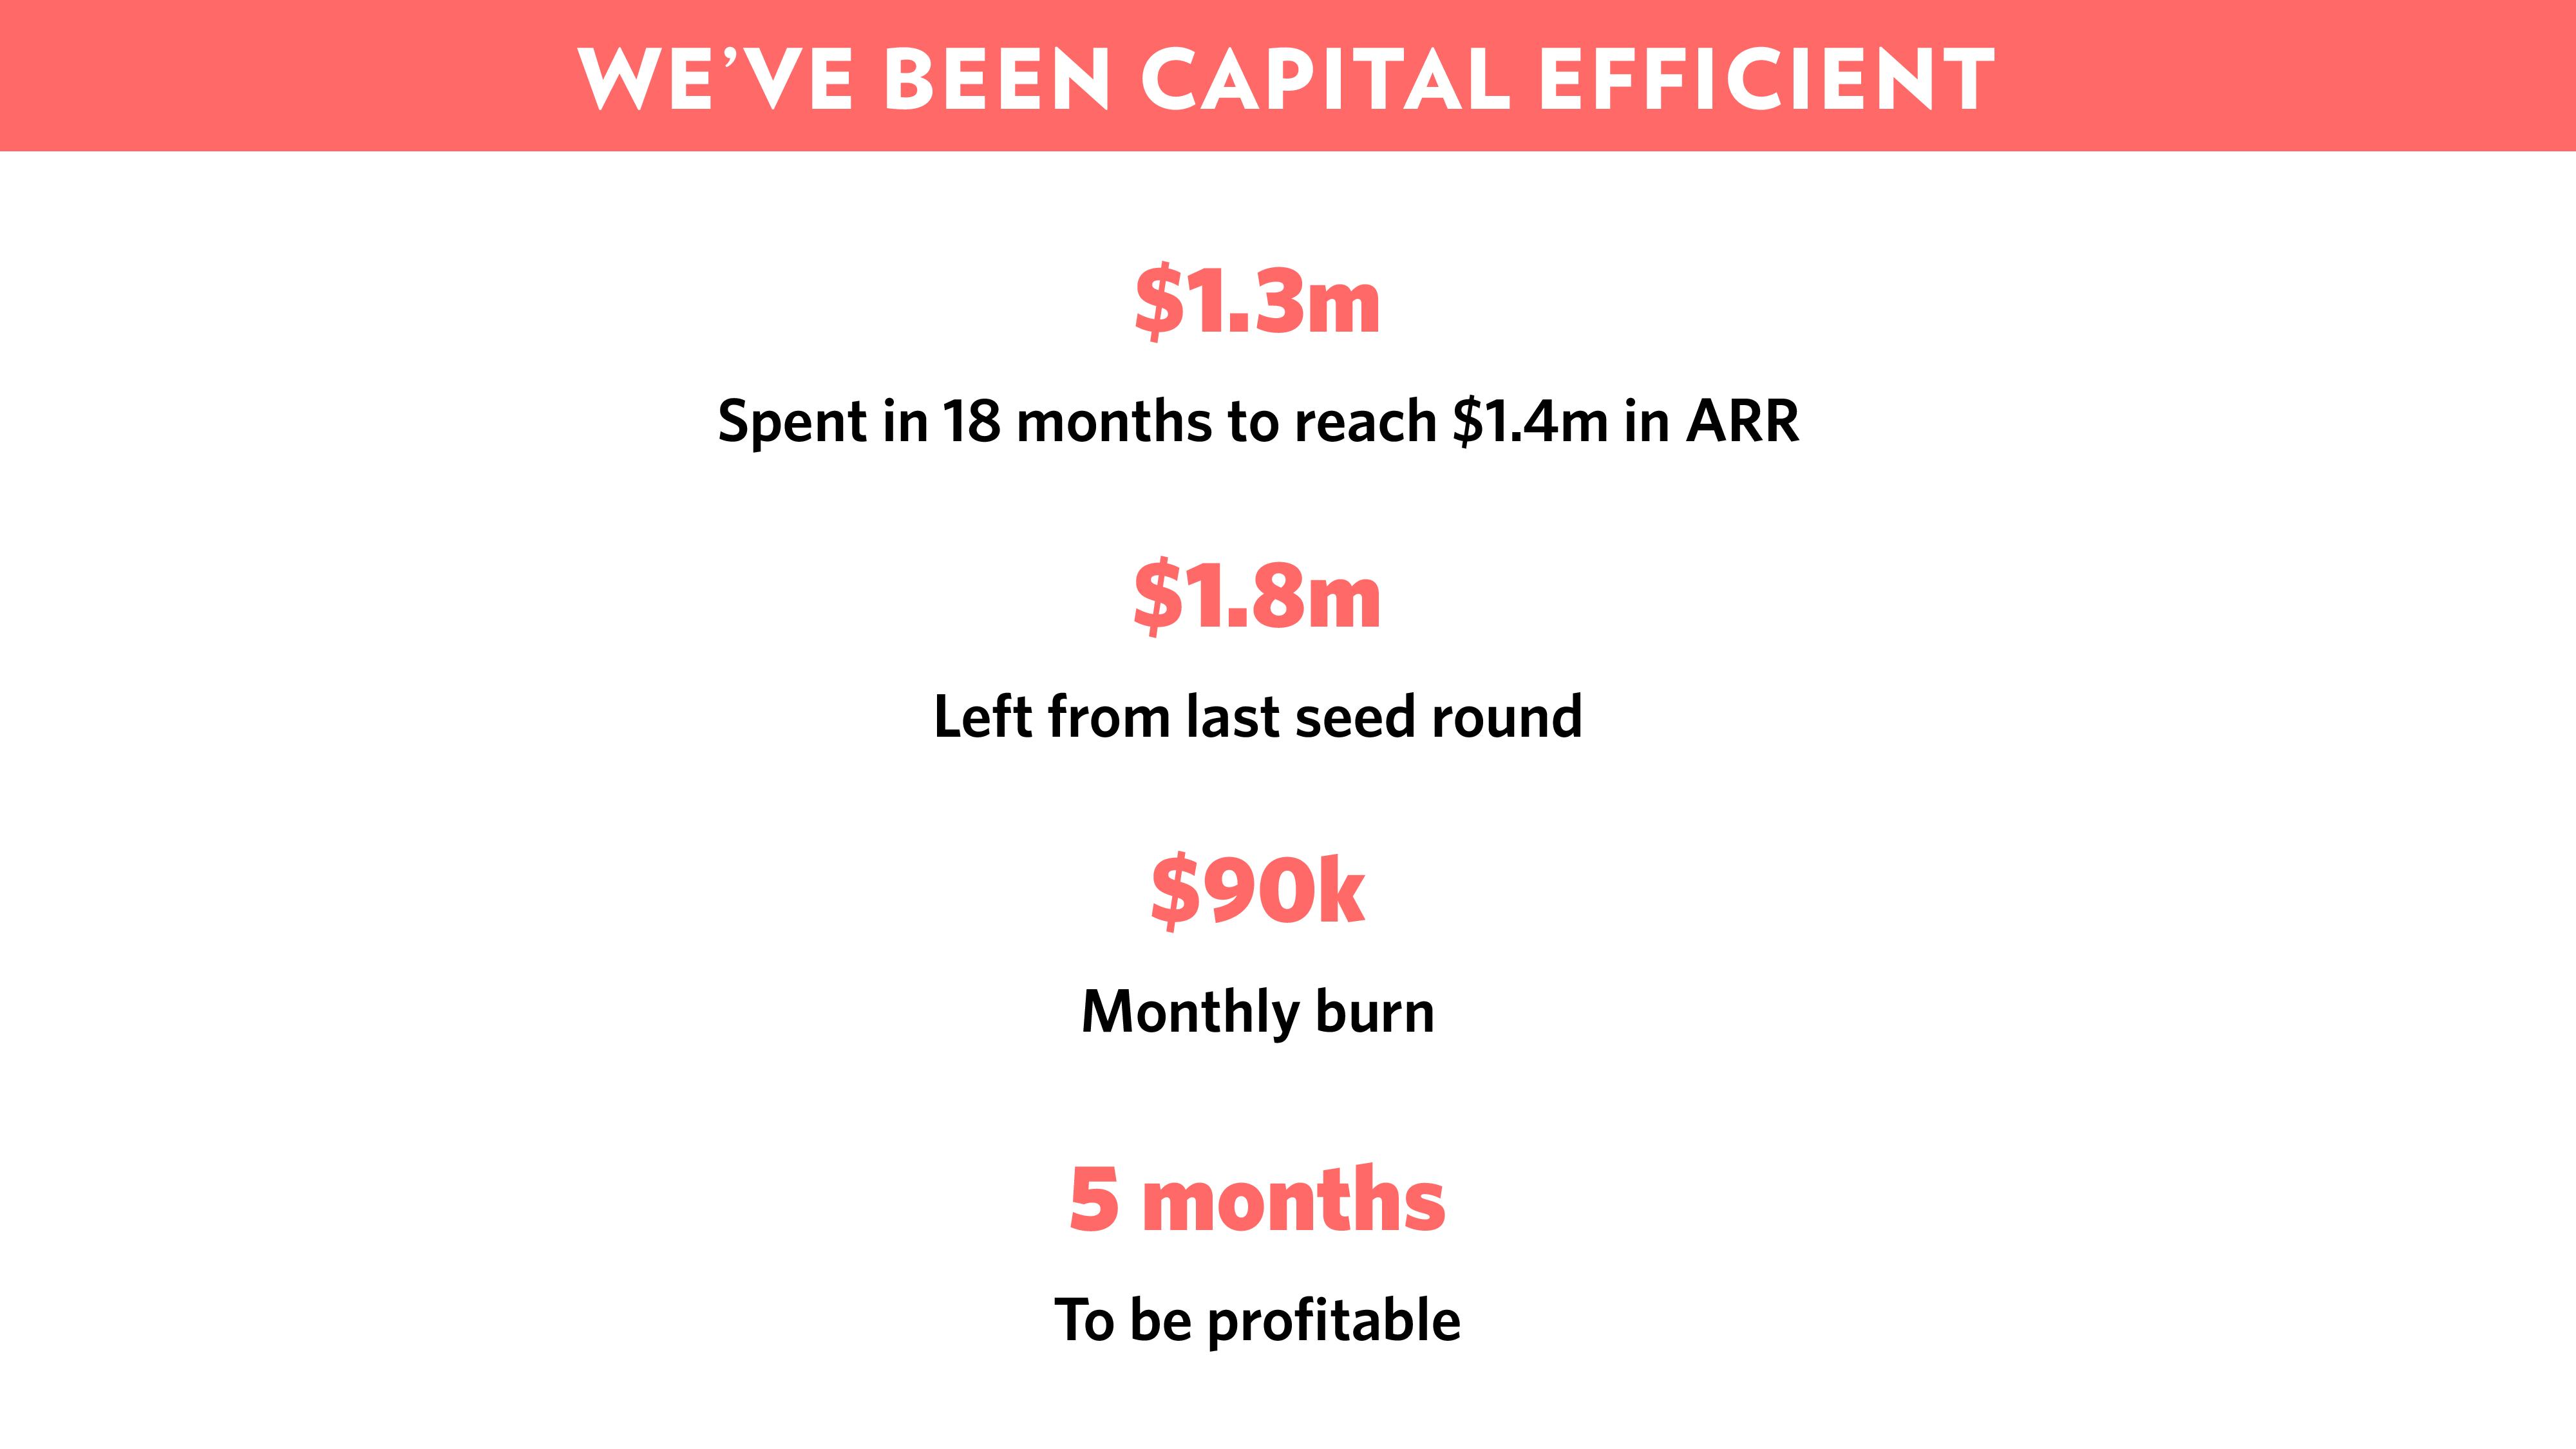
Front
Improve the Rest of Your Pitch Deck
Explore expert tips and resources to perfect every slide in your startup’s pitch deck.
Find your ideal investors now 🚀
Browse 5,000+ investors, share your pitch deck, and manage replies - all for free.
Get Started