Whether you are a founder looking to raise or someone who wants a career in venture capital, here are 12 necessary infographics to understand the basics of VC in no time.
Table of Contents
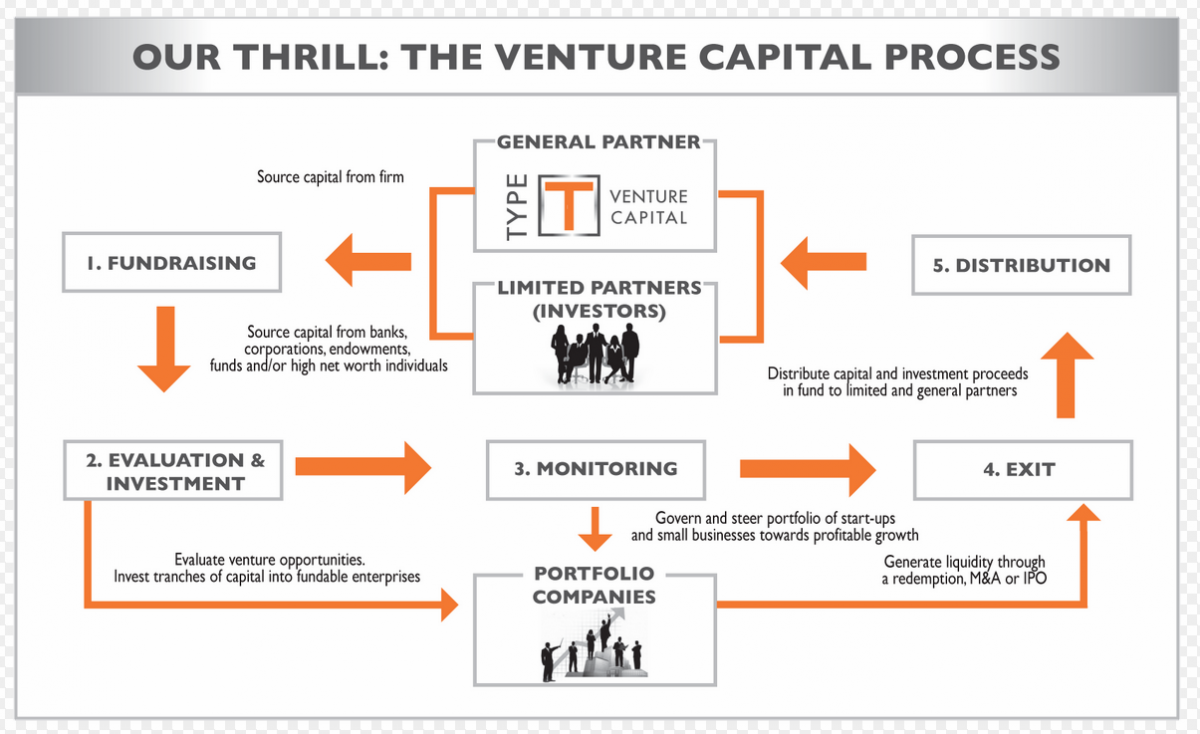
1. The Venture Capital Process
With VC being so popular among founders and startups, it is essential for current and future founders to understand the process of how a VC firm is formed and how they conduct business. This infographic from Market Consensus provides a simple but useful overview.
2. A GP's source of edge
If you want to be a successful VC, you need to have an edge for investing in startups that are not only successful but provide the fund with major returns. But how does one develop such an edge? This chart from PE Insights is a great resource for those looking to be the next Arthur Rock.
3. The Power Law of Venture Capital
The Power Law states that venture capital funds cannot achieve success without at least one bet so extraordinary that its gains return the entire value of the fund to investors (think Peter Thiel’s early investment in Facebook or Sequoia’s early investment in Apple). This is difficult as the vast majority of startups will fail or will never get past the seed stage. A big thanks to Alex Paterson-Pochet for the chart.
4. The Traditional VC Pipeline Is Expanding
Venture capital is no longer a requirement for startups who desire to scale up fast and IPOs are no longer the sole form of an exit. This infographic courtesy of CBInsights shows that fundraising options are expanding to include rolling funds, angel investments, and crowdfunding as viable alternatives to venture capital. Founders are now able to choose what form of funding will be the best fit for their company. Additionally, exit options now include SPACs (special purpose acquisition company) and DPOs (direct public offerings).
5. VC ownership & founder dilution
It is essential for founders to understand what happens when they finally get a yes to their pitch from a VC. VC’s only invest in companies that they believe can have a major return. This is often at odds with many founders who would be happier with a smaller exit. Furthermore, each round of fundraising further dilutes the founders, until they are left with a much smaller piece of the very company they started. This infographic from the Hustle breaks it down in detail.
6. Gartner Hype Cycle
The Gartner hype cycle is a graphical presentation developed by Gartner, an American research, advisory, and information technology firm. It represents the maturity, adoption, and social application of specific technologies. The graph aims to provide a conceptual presentation of the maturity of emerging technologies through five phases which are showcased below.
7. Relationship between valuation and traction
Early stage valuations for startups are hard to understand as there is little traction or data in the first two years of operations. The valuation vs traction matrix by Jason Calacanis aims to help founders so that they can avoid overoptimizing their company valuation early and avoid taking in dumb money in order to save it for smart money. It also seeks to help investors so that they can see when they should invest and where their investment would be on the matrix.
8. B2B Marketplace Funding Napkin
Every year, Point Nine Capital shares their insights of the state of funding with a simple napkin. In 2022, they looked at B2B marketplaces, collected data from 51 funding rounds, and provided their findings in a unique and simple manner.

9. Revenue growth rate
The following infographic courtesy of Neeraj Agrawal illustrates how seven high profile public SaaS companies grew their revenue. They followed the T2D3 growth path for their success. T2D3 means they tripled their revenue twice and then doubled for three more times. This has since become a standard growth pattern for VC-backed startups.
10. Scalable customer acquisition channels for $100 million ARR
Christoph Janz created a wonderful infographic that demonstrates five ways to build a $100 million SaaS business. Essentially, founders need to find customer acquisition channels that are highly scalable and profitable. He illustrates this via five different animals and what they mean for the company.
11. What's needed to build $100M
Building a $100 million product requires more than grit and a vision. It requires a market-product fit (yes, you read that right), product-channel fit, channel-model fit, and finally a model-market fit. Brian Balfour provides this infographic of the four fits framework to keep it all in check.
12. Roadmap to a SaaS IPO
We wrote a previous article on how to Unicorn a startup, where we included the following infographic. Essentially, it would take six years for a company to achieve a valuation of a Saas Unicorn and nine years for an IPO. This chart breaks down the headcount, revenue, and losses during that time frame.
Bonus: Why (portfolio) size matters.
A strong portfolio is important for any fund, but the size of the portfolio should also be taken into account. Dave McClure stated that the industry would be better served by doubling or even tripling the number of investments in a portfolio. Since the elusive Unicorn companies (startups with a valuation greater than $1 billion) only occur 1-2% of the time, the size of a fund’s portfolio should include a minimum of 50-100+ companies.

