Picture this: you’re a startup founder who recently picked up great traction.
Numbers climb up and you’ve decided to pull the trigger on fundraising (no better time for a raise than when KPIs are growing!). You’ve approached several VCs and generated promising discussions. One of the data-driven investors is asking to send over your KPI sheet, especially “raw cohorts”.
Ugh!
You’re a bit puzzled and ask ChatGPT to explain what cohorts actually are. “Cohort analysis allows you to examine the behaviour and performance of groups of users related by common attributes."
Now, this is a definition that you might be familiar with if you're a power user of Google Analytics but otherwise might sound just a *little* too technical (or even flat-out scary) for an average founder.
We don't blame you! Cohorts are often unnecessarily feared. Taking a few moments to understand this concept is key to operating a successful online business, especially if you're looking to ramp up your marketing budget or planning on making drastic product changes.
Understanding the principles of cohort analysis also provides a foundation to accurately calculate an LTV to CAC ratio – LTV (“lifetime value”) / CAC (“customer acquisition cost”) - which often is oversimplified resulting in distorted views of actual marketing efficiency.
These metrics are core to any well-structured startup financial model, helping founders make data-driven decisions around growth, fundraising, and sustainability.
Table of Contents
Cohorts 101
If you’re a founder who monetizes with subscriptions, you simply must learn how to read and understand cohorts. They are incredibly valuable for any recurring, user-based business. Spotify can tell if premium users who converted from their student plan are more loyal than those who jumped straight to full price. Duolingo might learn that users who join through friend referrals maintain their daily streak longer than those who discover the app through ads. Netflix can see if subscribers who joined during the Stranger Things release stick around longer than those who signed up during Squid Game, and so on.
Put simply, cohorts are all about analysing your customers by dividing them into subgroups based on a common characteristic. This can be as granular as you want - being based on gender, country, device type, and more - but most often a (user) acquisition or install date is a natural starting point, before taking a more detailed view.
The idea here is to dive deeper into your KPIs to assess whether there are any notable trends in the way that newer customers behave vs. early adopters, and perhaps whether different marketing strategies acquire more or less engaged users. Retention patterns like these play a big role in proving product-market fit to investors.
Many performance indicators can be analysed from a cohort perspective such as monthly usage, payer penetration, and average order value to give a few examples.
Startups are able to collect more data than ever before, and cohorts can be an extremely powerful tool for the digital entrepreneur, allowing us to examine how customer behaviour evolves in multiple dimensions:
- Customer Engagement : how behavior compares for customers as the company's offering has evolved (e.g. how are Jan-25 customers behaving in their second month vs. those that joined a year ago)
- Customer Lifetime : how behavior varies along the lifetime for a specific group of customers (e.g. what percentage of the Jan-24 customers were active 6 months later)
Retention trends will of course depend on the metric being analysed as well as the industry we operate in. An online seller of used cars will clearly observe very different trends compared to a B2B SaaS, but across verticals, it's common to see the sharpest declines in the first few months of customer activity (most customers drop out quickly)

This Is Becoming TLDR, Let’s Look At Some Data
Let's take an imaginary example of a trendy AI chatbot wrapper called "TwelveAI” - a new GenAI-powered service that exclusively offers natural-sounding, audible responses to all your weird and wonderful queries.
Since our beta launch in January 2024 and following a successful Series A, the app has skyrocketed in popularity to now reach 1.4 million monthly users organically, just 2 months later. Amazing figures on the surface to say the least. But we’ve got VC money to burn, so we want to grow faster, much faster… and so paid marketing begins on all fronts in May 2024.
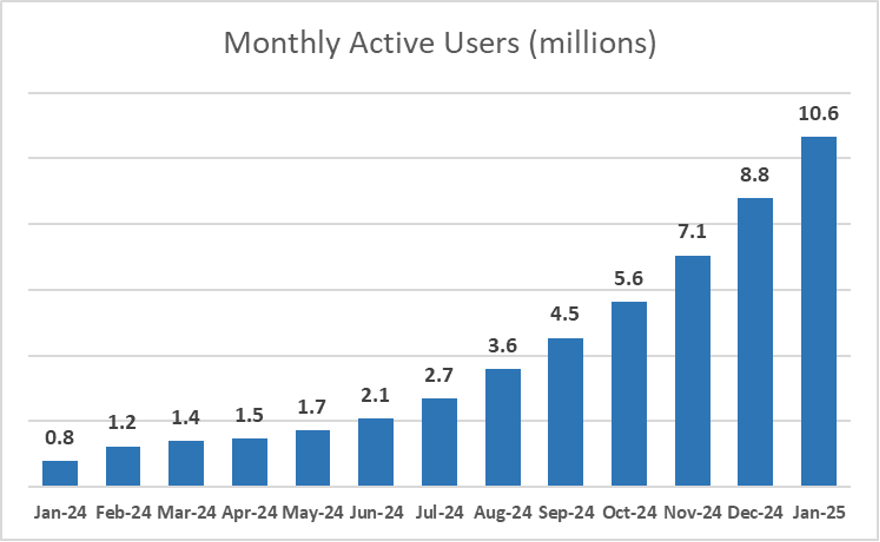
Boom! It’s now a year later and we’ve crossed to 10-million-user-mark milestone, and it’s time for our Series B raise. We’ve got that enviable hockey-stick growth and many new VCs knocking on our door eager to participate in the round. But ultimately, some startups are not VC fundable.
And to our surprise, the investors want to do due diligence on our numbers, even after seeing our vertical growth (shock-horror as the “AI” in our name wasn’t enough this time).
Luckily, we’ve got a great CFO onboard that built a winning data room from day one so we can easily send VCs our active user numbers by cohort - which we’ve defined to be the month when users first installed our app. We let our new potential investors know that we define a user as active if they log in to our app at least once during a particular month and send them this data below in a spreadsheet.
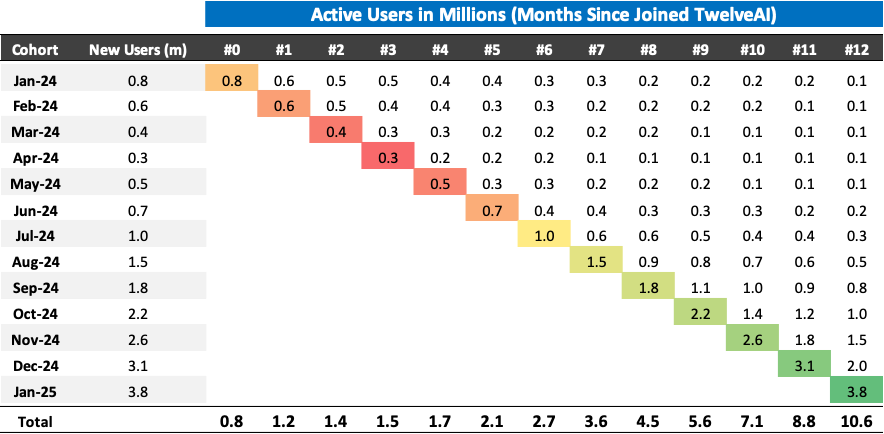
So, lots of numbers for them to analyse. But what does this all mean, and how can we best prepare for their potential lines of questioning?
With this current data presentation, it’s difficult to draw any real conclusions. We’re already well aware that our user growth has started to pick up from our paid installs.
Cohort data becomes a lot more meaningful when we start to look at the underlying retention ratios. Let's flip the triangle to look at the data on a relative basis (since month of first install) and also calculate the retention percentages to examine how the usage behaviour has evolved.
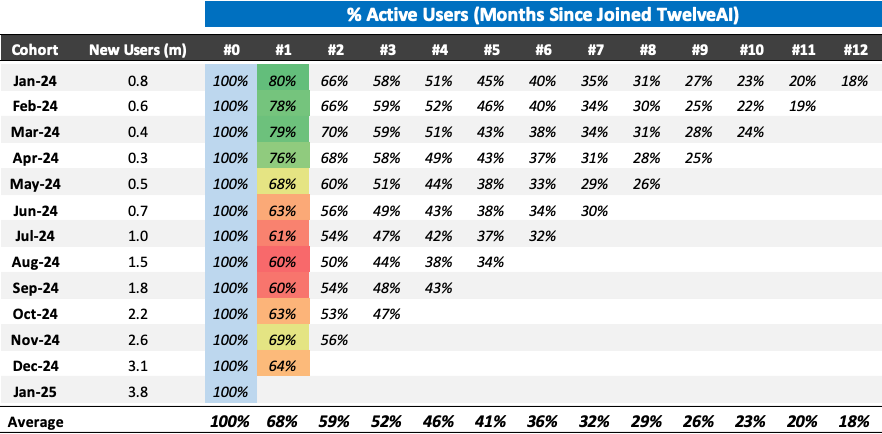
Some initial observations after seeing this transformed data:
- Cohorts in this example always start at 100%, since we count new customers based on when they first install our app. Hence by default, they are always counted as active in Month #0.
- Our Month #1 trends show a significant negative impact on retention, as only 64% of customers are marking an order in the month after joining versus the ~80% we were seeing in the early days.
- Conclusions drawn for the outer months will always be less reliable. We only have one data point for Month #12 vs. twelve for Month #2.
That sea of red doesn’t look great, and it happened right at the time of our huge marketing efforts to acquire new users through various paid channels.
Naturally, we can expect the VCs to raise a couple of questions on the effectiveness of our marketing strategy, and maybe we might want to re-think the most effective acquisition channel for TwelveAI after all.
We might now want to take a closer look at our marketing channels to see which ones are worth our high cost per install. If there’s sufficient data collected, it’s certainly possible to split out this cohort triangle by marketing channel - to more thoroughly examine the behaviours of our user groups depending on where they come from.
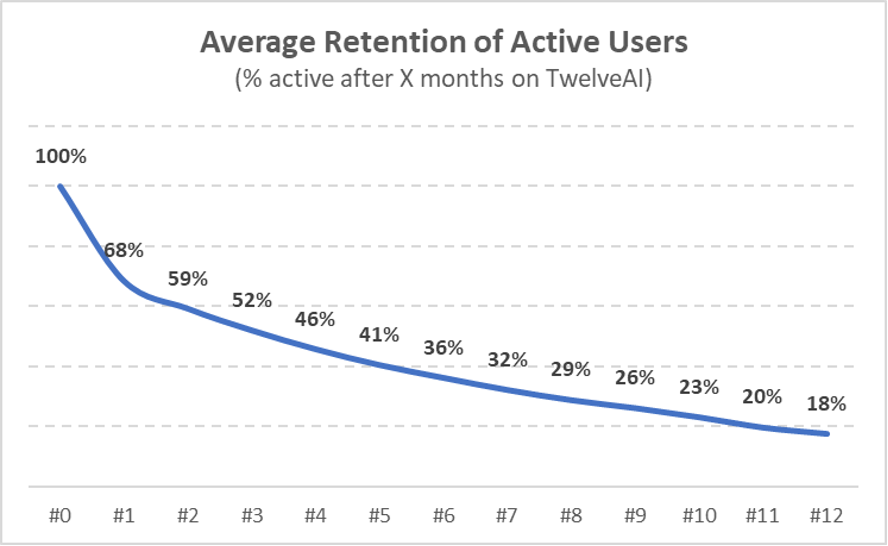
Note how this trend is impossible to find by just analysing the data on an aggregate basis. The average retention trends paint a rosy picture with ~80% of customers returning in their second month with ~20% as a long-tail.
Average retention can still play an important part in revenue forecasting in many segments across digital and is often considered when valuing a startup.
And as part of a revenue modeling logic, it enables us to bridge customer acquisition to the all important MAU metrics, as well as lay the foundation for calculating accurate user lifetimes.
Why Cohorts Matter for LTV to CAC Ratio Calculations
Understanding and deriving an accurate retention curve is at the core of calculating customer lifetime value.
While calculating customer acquisition cost is often very quick (simply dividing the total spent on a particular marketing channel by the number of users acquired), deriving lifetime value is a bit more complex as it requires estimation given future uncertainty.
This can be done in a few steps after you’ve understood the foundational concepts of cohorts and retention analysis -
- Derive the Retention Curve: follow the transformation steps described above to prepare a cohort triangle and determine average retention. This might need to be projected out depending on how many months of historic data you have - unless you have a rapidly declining retention curve, at least 5-7 years of data is recommended.
- Calculate Average Revenue per Month: total revenue in month since joined / number of underlying customers.
- Calculate Expected Revenue per Month: average revenue per month x retention rate for each month.
- LTV Estimate: sum of expected revenue for each month along the retention curve.
One way to visualise this and form the intuition here is to imagine multiplying in estimated monthly revenue for each point along the retention curve - and then adding up each of the cash flows along the customer journey.

Wrap Up
Despite all the terminology involved, cohort analysis isn’t that complicated once you’ve seen a few examples - and after building some initial familiarity, it becomes quite intuitive.
By analysing your customer base in smaller groups, you can uncover incredibly valuable insights which aren’t visible at the aggregate level - helping to guide all kinds of business decisions relating to product developments, customer retention, new marketing channels, and much more.
Cohorts seem scary but you don't need a PhD to get started, just start with simple questions about your business: When do my customers typically make their second purchase? Which features do my most loyal users engage with first? How do different sign-up channels affect long-term retention? What is our most accurate LTV / CAC estimate, and how effective is our marketing strategy?
The answers to these questions, viewed through the lens of cohort analysis (and a little bit of Excel magic) will transform how you think about your customer journey and where to focus your efforts.
About the author
Nikhil Parmar is a co-founder of Multiples, an online valuation benchmarking platform built for the VC and tech M&A ecosystem. Nikhil has also co-founded of Flow Partners, a modern financial advisory firm supporting digital companies in M&A, fundraising and CFO services. With over 15 years of industry experience, he has a passion and expertise in software, cybersecurity, IoT and technology infrastructure.